In the first part of this series, published in the April 2026 issue, I introduced the notion that introductory digital storage oscilloscopes (DSOs) don’t require a large investment and that the vast majority of automotive diagnostics can be accomplished with a $200 DSO and a laptop. The goal is to give technicians a pathway to explore oscilloscope- based diagnostics without the burden of a huge tool investment. In the second part of this series, I’ll focus on measuring and interpreting common input signals that make great use of a DSO.
A QUICK REFRESHER FROM THE FIRST ARTICLE
Voltage limits: DSOs have a maximum input voltage, and lower-cost DSOs often have a lower maximum input voltage rating. Since this article mainly focuses on input circuits, we likely won’t measure anything more than charging system voltage, but keep in mind that if you are measuring an output device, inductive voltage spikes can easily exceed the maximum input voltage rating. 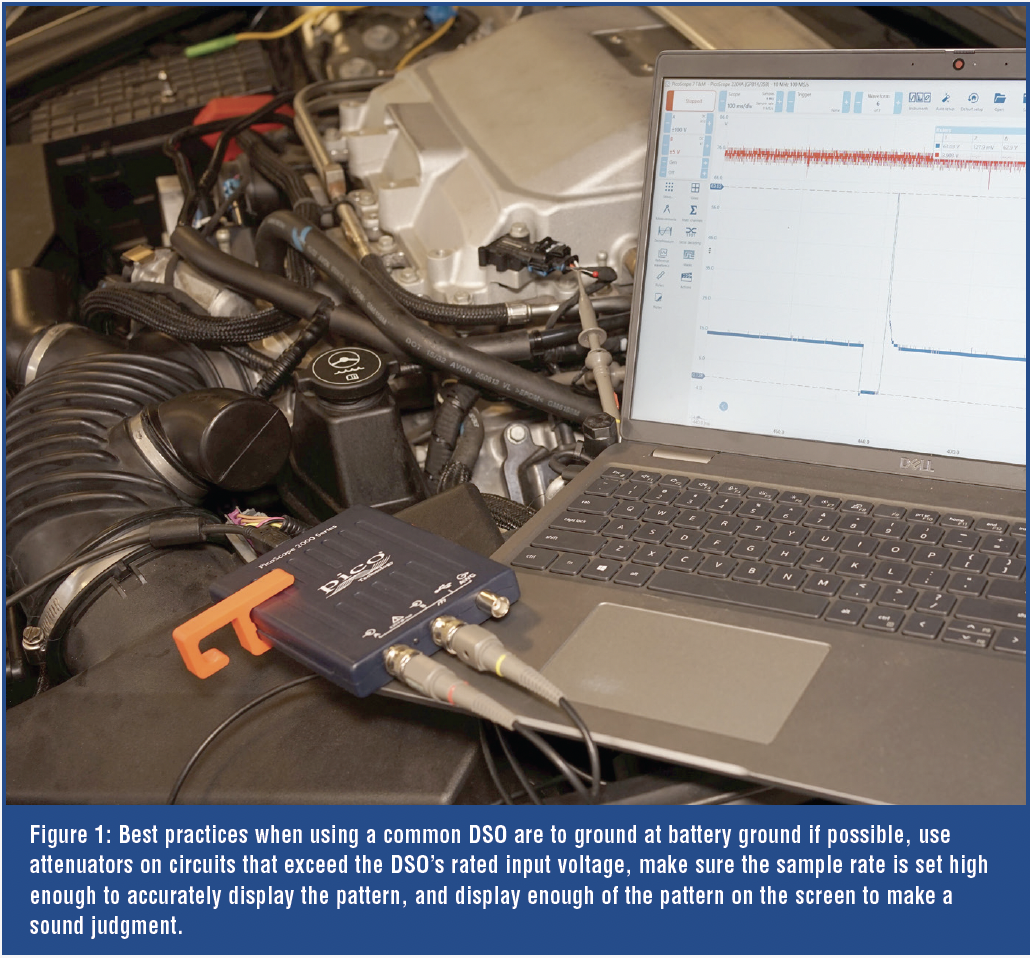 For that reason, use an attenuator when checking circuits that might have voltage spikes or high voltage. An attenuator reduces voltage by its attenuation ratio. A 10x (10:1) attenuator reduces the voltage the DSO receives by a factor of 10, and a 20x (20:1) attenuator reduces it by a factor of 20. The attenuators protect the DSO from damage. When using an attenuator, remember to change the channel’s “probe” setting to match the attenuator size; this corrects the measurements and values displayed on the DSO.
Use battery ground: Many DSOs share a common ground between channels. For this reason, it’s good practice to place the ground lead on the battery ground, so you don’t inadvertently short multiple channels together through the scope and scope leads (Figure 1). This is a very common mistake, especially when checking speed sensors. Many technicians measure across the engine’s speed sensors, and that’s fine with a Digital Multimeter (DMM), but it might get you in trouble with a DSO. Depending on what circuits are probed, it’s possible to pull one sensor down by shorting it through the DSO to the other sensor. As mentioned in the first article, you have to unlearn some DMM techniques when using a DSO. With a DMM, it’s common practice to connect across a circuit with the meter leads (voltage drop), and since a DMM only has one channel, that’s perfectly acceptable. Some more expensive scopes ave isolated grounds for each channel, but many don’t, so when using a DSO, it’s best to play it safe and ground the DSO to battery ground.

Add time to the screen: Set a longer time scale and zoom in as needed. Many scopes are preset at a fast time scale and show only milliseconds per screen. Add time to the DSO’s display to show at least a second or two. If needed, it’s easy to zoom in on a capture that is too congested to achieve finer detail. On the Pico 2204a, it actually samples at a higher rate when set to 100ms per division or greater than if you have it set at a faster time scale, so with this DSO, it’s actually to your advantage to capture at a higher time base.
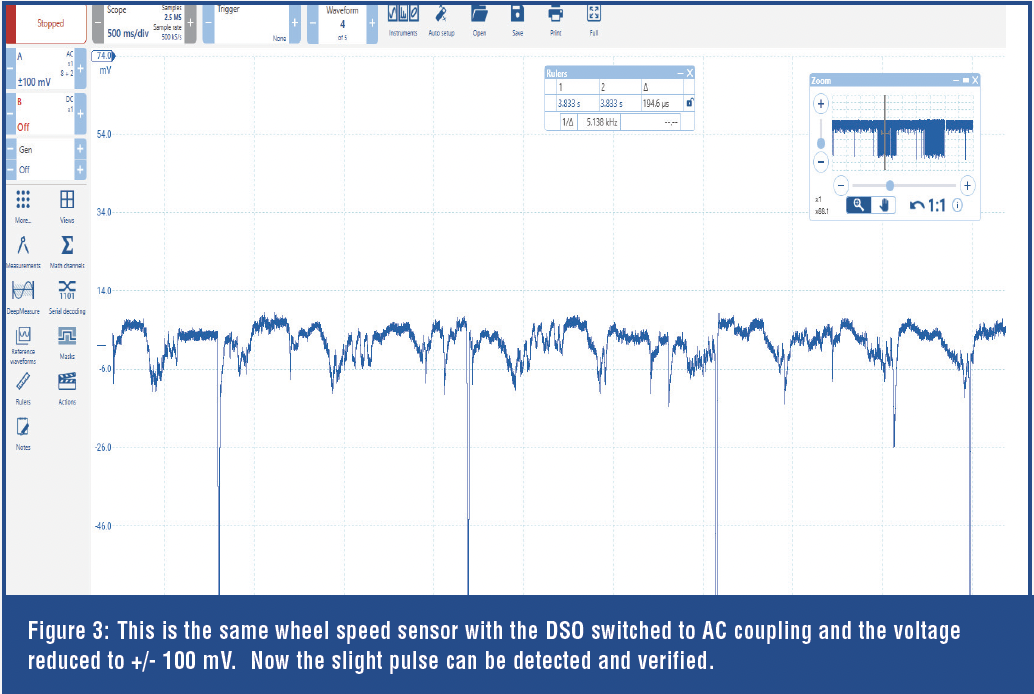
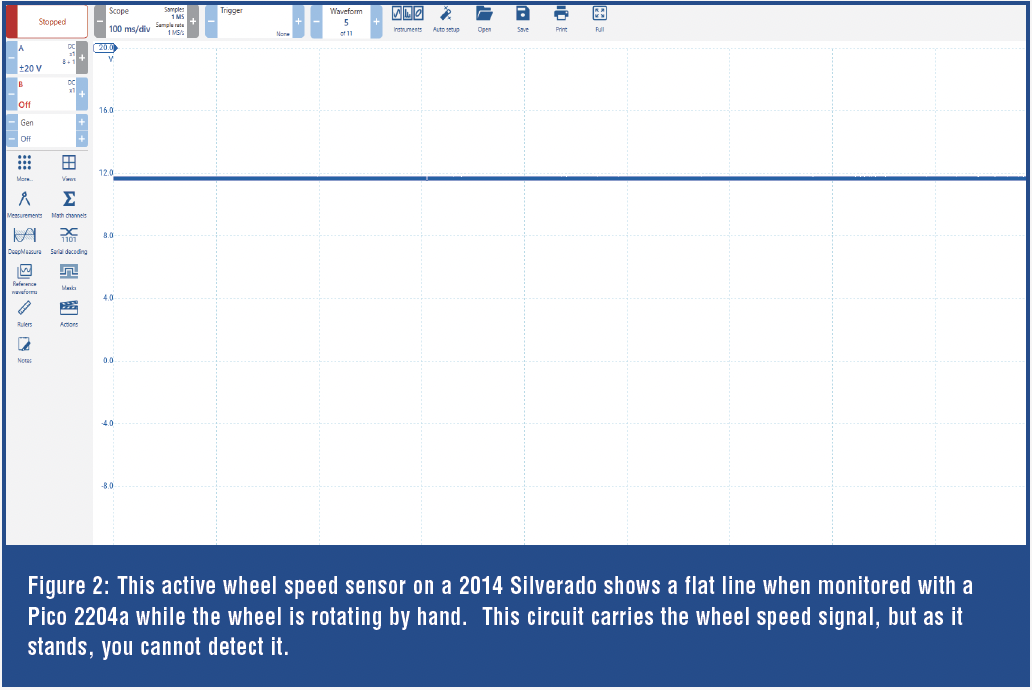 Know good to identify bad: If possible, capture a good signal to compare to the suspected bad signal. Sometimes you can get an odd scope reading and assume that the pattern is bad and the sensor or circuit is at fault. By checking a known good circuit, you can verify the scope, settings, and expected pattern. For example, when checking a wheel speed sensor circuit on a 2014 GM Silverado with an active hall/magneto-resistive type speed sensor, you will likely find a flat-line voltage hovering around 12 volts (Figure 2). This is normal for this sensor. You might be surprised to find that there is a small pulse hiding in that pattern. If you switch the DSO to AC coupling and lower the voltage to +/-100mV, you’ll see the signal has a slight pulse (Figure 3).
It switches by only about 85 millivolts when the wheel is rotating. You might be wondering how the module can even pick up a signal this faint. The ABS module isn’t actually monitoring the voltage change. It measures the slight change in current flow, and that amperage change causes a slight voltage change, indicating the circuit is working as intended. These advanced wheel speed sensors output a very short pulse to indicate forward or reverse rotation. On this vehicle, the pulse is about 120 microseconds in one direction and about 210 microseconds in the other. That’s how the ABS module knows which direction the wheel is rotating. These sensors are also used in transmissions and engines. If you are interested in learning more about these sensors, refer to the Gears April 2024 and May 2024 issues.

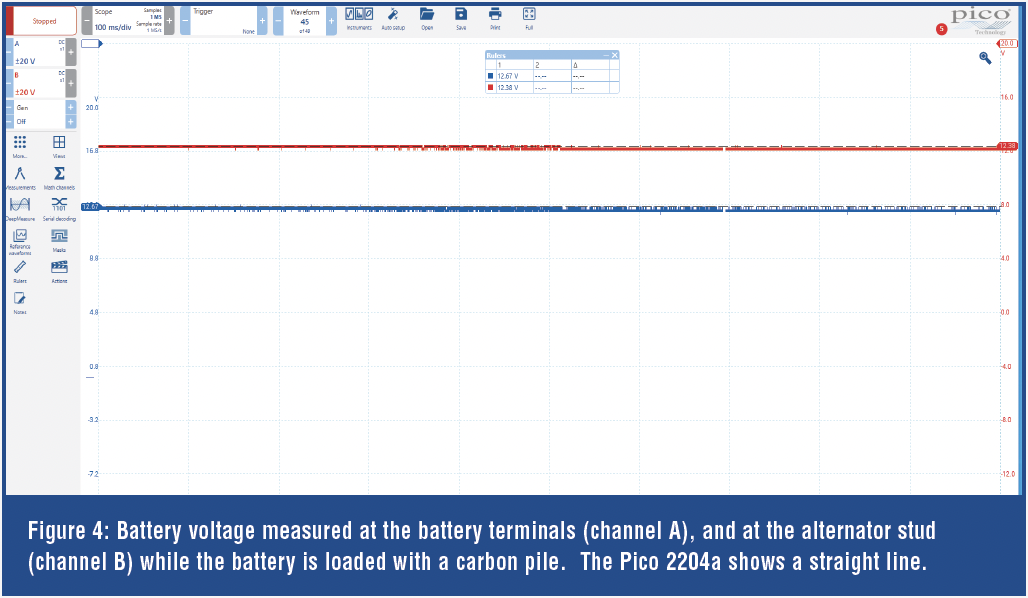
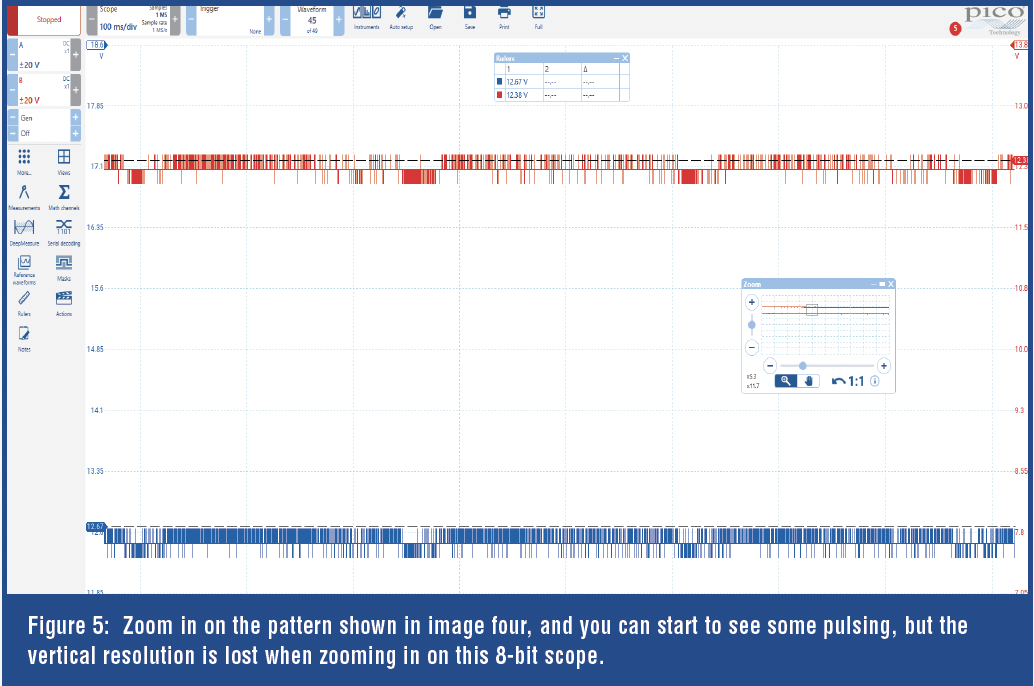
On a side note, with an inexpensive DSO such as the 2204a, the trade-off compared to a higher-level DSO is display resolution. This is an 8-bit DSO that doesn’t have as many “points” to draw the scope pattern, so if you vertically zoom into the pattern, it will likely become stair-steppy or have no fine definition. If you have a switching pattern that doesn’t change much in voltage, especially one riding on a DC voltage, you can place the DSO in AC coupling, and it will ignore the DC voltage and only display the oscillations or switching pattern across the 0V point. Then you can lower your voltage scale to improve the pattern quality. This is a drawback of the inexpensive 8-bit DSO, but if you are aware of it, you can work around it.
 Using this technique is useful for checking things like the aforementioned active wheel speed sensor, an alternator’s ripple, an engine’s relative compression, or any signal with slight oscillations riding on a DC voltage.
For another example, Figures 4, 5, and 6 show diode ripple and field control on the 2014 Silverado’s charging system. There is nothing wrong with this alternator (remember, know good to determine bad). In this case, if you set the DSO to DC voltage (+/- 20v scale) on an 8-bit scope, you will lose clarity when zooming in to inspect the ripple (image five). But by setting the DSO to AC coupling and lowering the voltage to +/- 500 mV or less, you’ll see a pattern with the detail you need to analyze the circuit or component, as shown in image six.
 VALUE OF A DSO FOR MEASURING INPUTS
As we know, a DSO provides a visual representation of voltage over time. This is beneficial when monitoring circuits to ensure:
- The signal isn’t intermittently dropping out.
- That switching signals can build up to source voltage and pull to ground
- There is no interference or noise.
- That synchronized signals are in fact aligned and in time.
These aspects show the DSO’s true strength. The DMM can monitor circuit voltage effectively, but because it displays an average, it can easily miss an intermittent dropout. The DMM can monitor source voltage and ground connections, but with a fast-switching circuit, it cannot provide that level of analysis to prove proper operation. Without explanation, the DMM obviously cannot check for multiple signal synchronizations. These are the attributes where the DSO shines and complements a DMM’s versatility.
 The following are common tests performed with a DSO. In these examples, I’m using the inexpensive Pico 2204a to demonstrate that circuit analysis doesn’t require an expensive DSO loaded with features. As mentioned, this DSO costs less than $200 and is very capable when set up properly, with its limitations in mind.
CAM/CKP SIGNAL ANALYSIS AND RELATIONSHIP
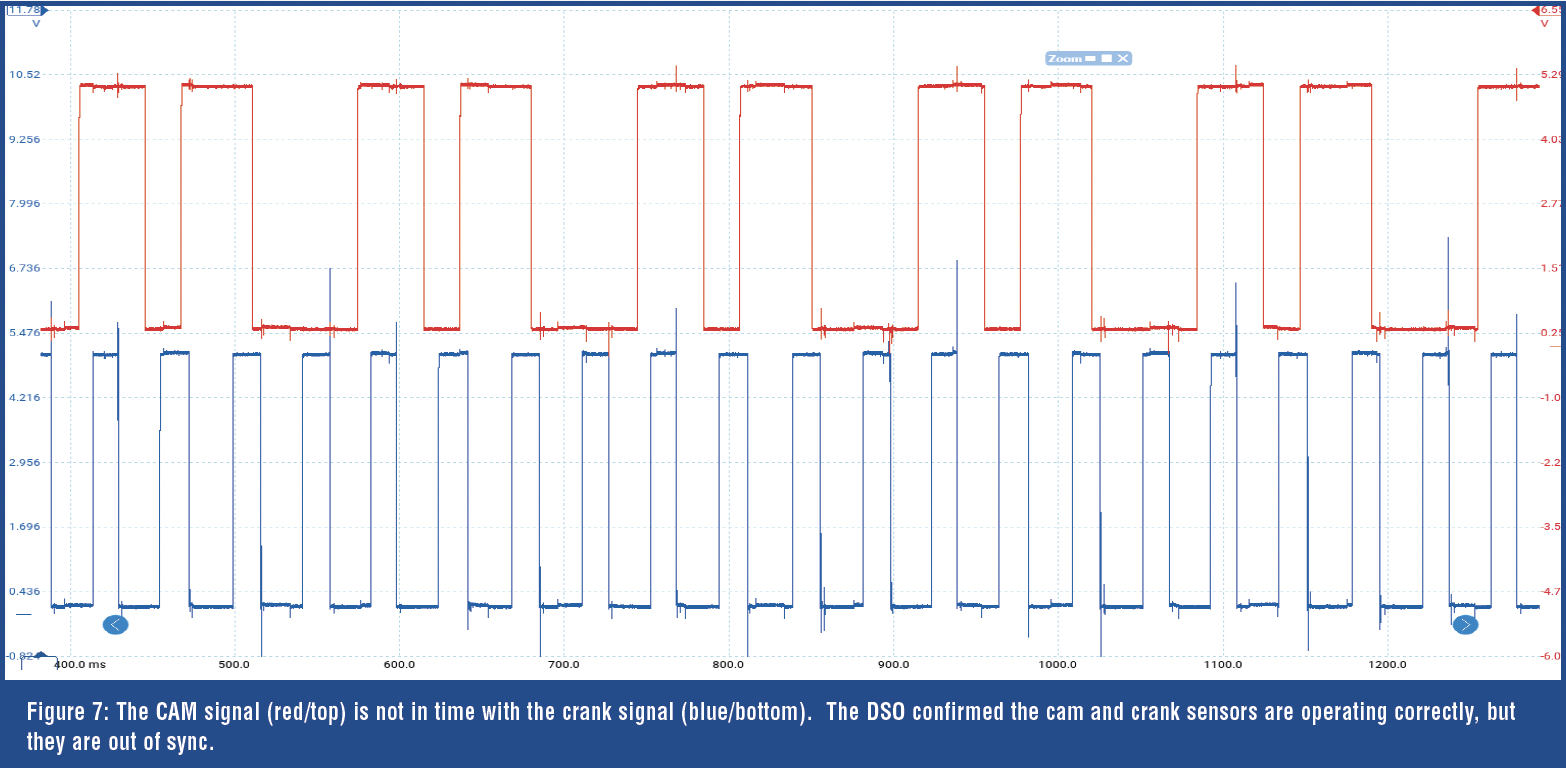
A two-channel (or greater) DSO can not only verify the integrity of a cam and crank sensor, but it can also confirm proper sequence and alignment. Referring to Figure 7, when checking this Mitsubishi Lancer for a suspected timing jump, we probed the CKP and CMP signals and grounded the leads to battery ground.
There are a few observations we can make with the CAM/CKP signal, courtesy of the DSO pattern. We can see the CAM/CKP signal adequately switches between source voltage and ground consistently without dropouts, verifying proper sensor operation. We can also check CAM and CKP sensor signal alignment. Without a known-good reference waveform or a supplied pattern from the service info, it might be difficult to verify whether the pattern is in sync. 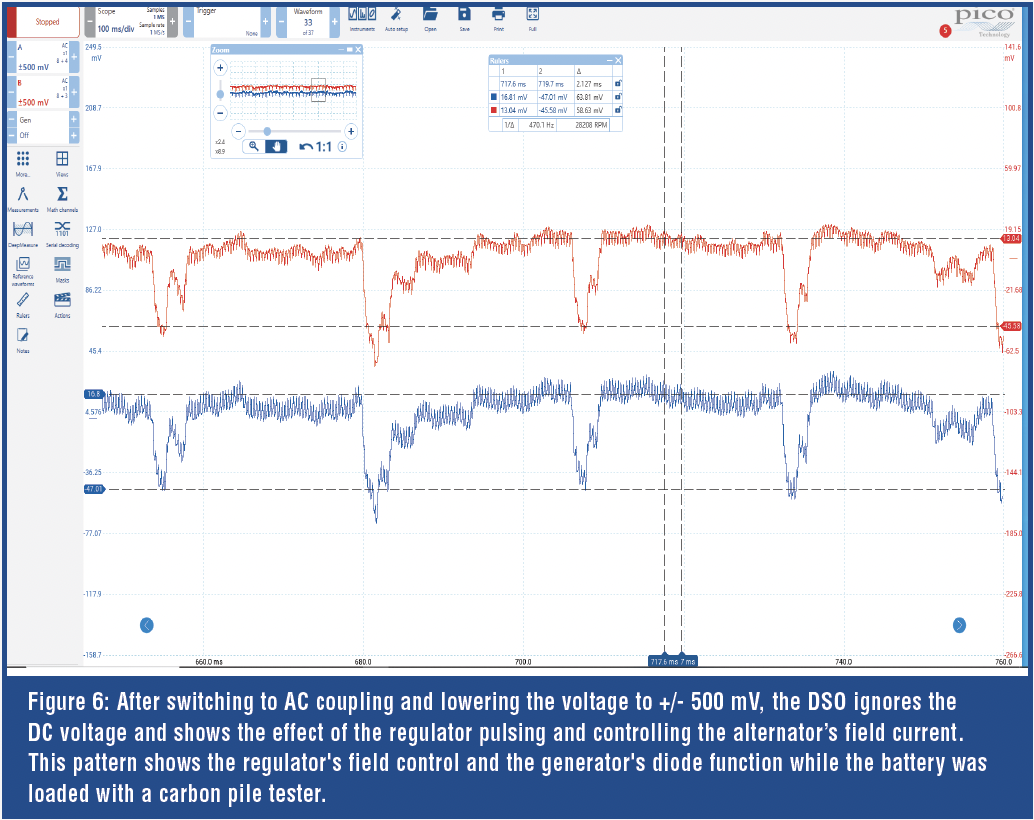 There are many places where you can find known-good waveforms, and in this AI era, there’s a good chance ChatGPT, Gemini, Grok, Copilot, or your AI of choice will find a known-good waveform for you. Heck, you could probably upload your capture and simply ask AI if it’s in time, although I wouldn’t trust it with 100% confidence. For verification, the IATN.net has a searchable database of waveforms. Diag.net is also an impressive resource where technicians share data and waveforms at request. Rotkee.com is a tool website that has a growing catalog of waveforms (and great tools as well). In this case, all of the above worked, and the service info also included an image showing what the relationship between CAM and CKP should look like. In this example, the cam timing was indeed off. You couldn’t get this result with a DMM or scan tool alone.
Another common use for checking inputs with a DSO is diagnosing networks, like the CAN bus. When modules stop communicating, you’re often left with limited diagnostics to find the network failure. A few things are handy in network diagnostics: 1. A good wiring schematic identifying connectors and circuits; 2. A DMM to quickly check for opens, shorts, and terminating resistance; 3. A DSO to evaluate network activity and signal quality and to check for signal anomalies.
 The pattern in Figure 8 shows the CAN C Bus from a 2013 Dodge Dart that lost one of the CAN C circuits to the RFID hub. This failure prevented the vehicle from powering up because the RFID hub is what accepts the ignition signal from the key fob and start/stop button. Turning on the hazard lights woke the network up, but if you’re familiar with the CAN network, you will quickly realize the signal shouldn’t look anything like the one shown in image eight. We measured this pattern at the Star connector for the CAN C behind the glovebox, and when we disconnected the RFID hub, the pattern straightened out, but the vehicle still couldn’t power up because the RFID hub was offline. The DSO helped us narrow our diagnostics down to one module and one circuit. Repairing the connector at the RFID hub fixed this vehicle.
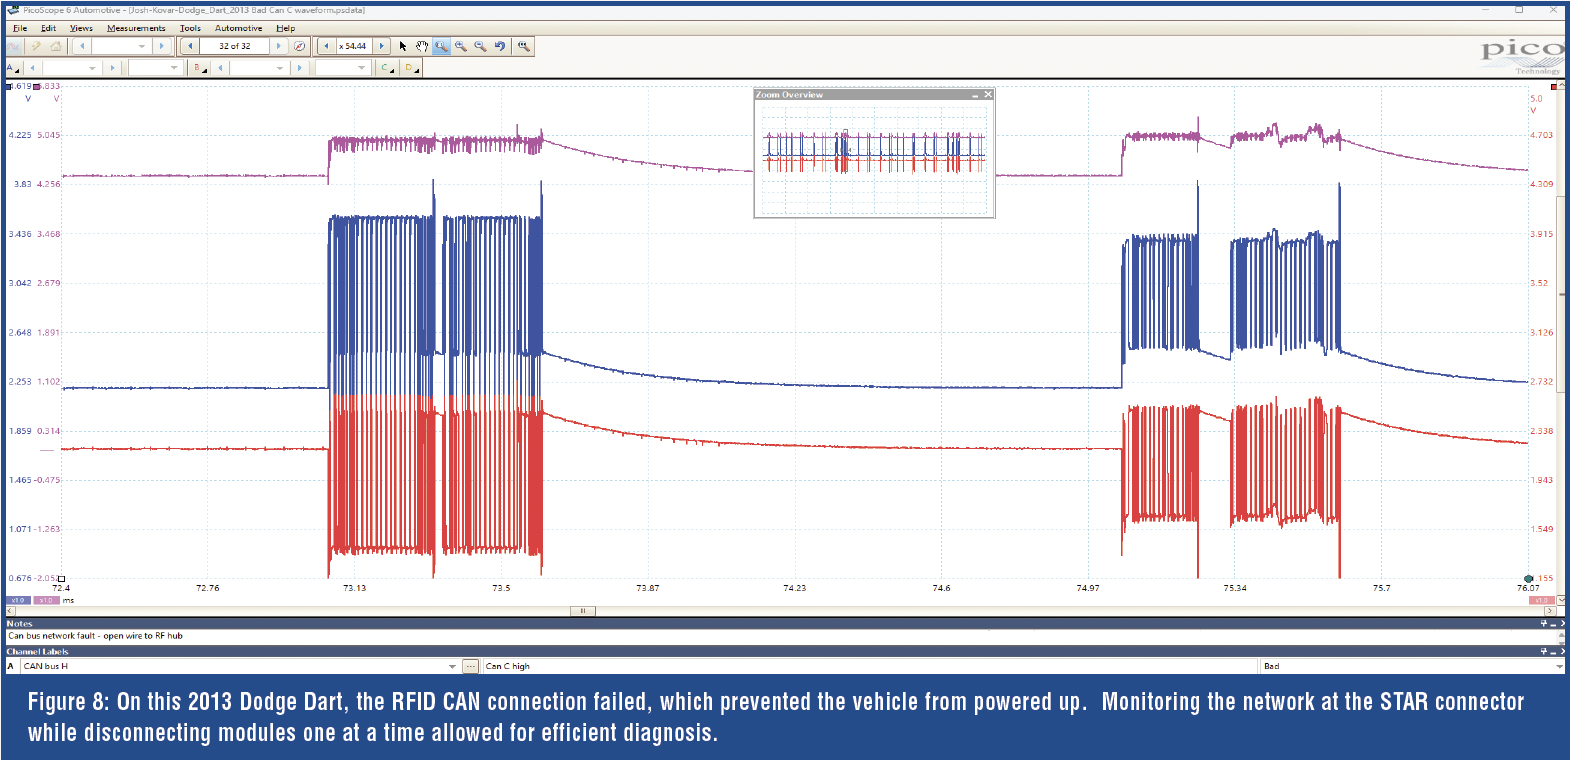 When using the DSO to evaluate a CAN network, you can also apply a “math” channel where you can add channel A to channel B, and it should equal a steady 5V. As shown in image eight, the math channel (top trace/ pink) did not display a steady 5V, indicating network imbalance and that something was skewing the network voltages. Once again, the DMM would only take you so far with this diagnosis. Using the DSO to inspect network voltages while disconnecting modules from the star connector helped narrow this diagnosis down to one module and its wiring with confidence.
Monitoring trigger signals is another great use for a DSO. Modules often send control signals to coils or other modules to trigger devices. A common example is when a PCM sends a pulsed signal to an ignitor within an ignition coil. If you monitor the signal wiring on a 3 or 4-wire coil (don’t do this on a 2-wire coil without an attenuator; more on that in a different article), you’ll see that the coil will turn on when voltage goes high (saturate the coil), and the coil will turn off when the voltage drops low (fire the plug).
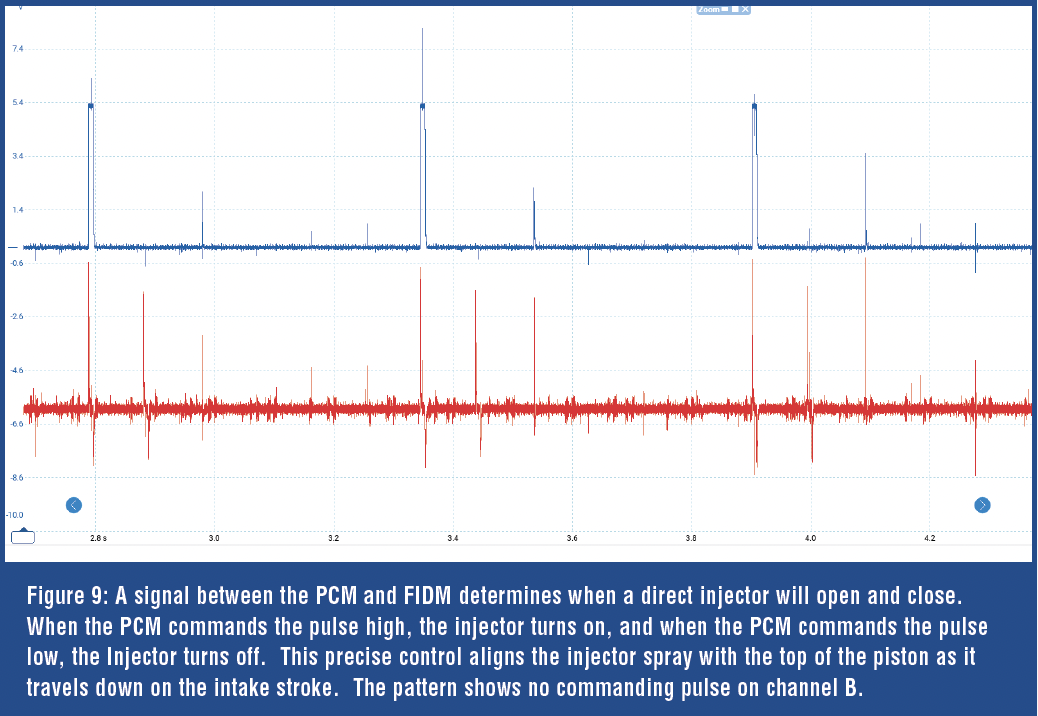 This circuit type is also used to control high-voltage GDI fuel injectors. Figure 9 shows the trigger commands for a Fuel Injector Driver Module (FIDM) on a Honda Direct Injection engine. With this vehicle, Honda used a separate module to control the GDI injectors. The FIDM receives the injection commands from the PCM. In this image, you can see that channel A (blue) received the trigger command, but channel B (red) did not. Either the PCM wasn’t sending the signal, there was a short to ground on the circuit, or a short to ground in the FIDM was pulling the circuit down. The signal returned when cranking the engine with the FIDM disconnected. This diagnostic step confirmed the FIDM was internally shorted, since the PCM and wiring could deliver the trigger.
These are just a few examples of how an inexpensive DSO can help fully diagnose input components and circuits, but there are many more. In the next article, I will focus on outputs. Almost all outputs or controls are either electromagnetic devices (solenoids, relays, coils, injectors, motors), lights, or heater elements. In the third part of this series, we will focus on getting you started with scopes by measuring and monitoring output components and circuits with an entry-level scope.