Technicians are like electricity; they take the path of least resistance during their diagnostic process. The easiest way to gather information is with the scan tool. The scan tool is a very powerful tool; however, don’t just browse through the PIDS, look at the PIDS in a very specific way, and develop a routine of how you use the scan tool. After we identify the vehicle using the scan tool, the next step is to check codes. If you have codes, take a snapshot of them so you can refer to them later.
When facing multiple codes, ask yourself if one of these codes triggers some of these other codes. Some codes, when set, automatically trigger others. An example of this is that diesels may set a mass air flow (MAF) code, which will trigger DPF-related codes. Technicians are aware of DPF problems on diesels, so they check the DPF to see if it is plugged up and may force a regeneration; however, if the DPF isn’t the issue, the MAF code automatically triggers the DPF code. Be aware of codes triggering codes. This can save time during your diagnostics.
 Before you start diagnosing the sensor, solenoid, or circuit that the code is pointing to, always look up the enabling criteria for the code. Enabling criteria are how and when the test is run. The enabling criteria will tell you things like the temperature range the test runs in, the speed range the vehicle must travel in, how long the test is, and whether any other codes may block that test from running.

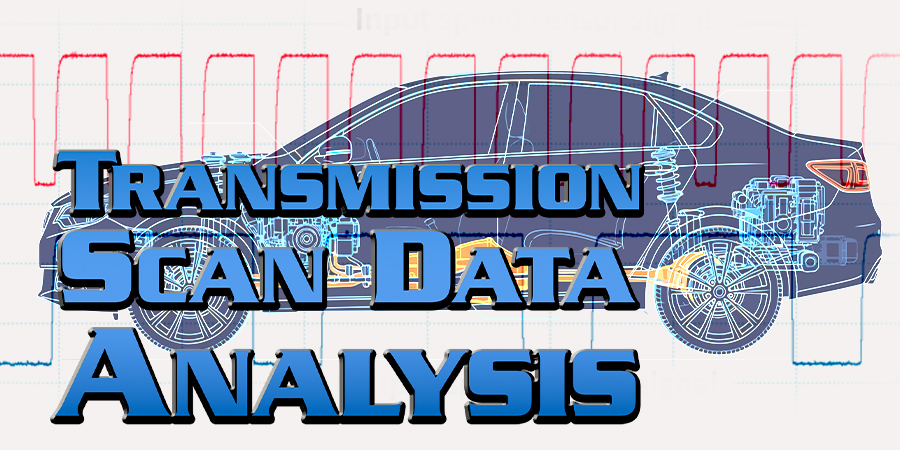
The next step is to review and record the freeze frame. Examine the freeze-frame to see if it points you in a diagnostic direction. Next, check whether there is mode 6 data. Mode 6 is the test results of a specific monitor. Mode 6 is found on the generic side of the scan tool. Mode 6 information provides the minimum and maximum values for the test and the test value. If you set a code, the test failed. The actual value, compared with the minimum and maximum values, will indicate how poorly the test performed. Mode 6 data can also be used after the repair to see how well the test passed (Figure 1).
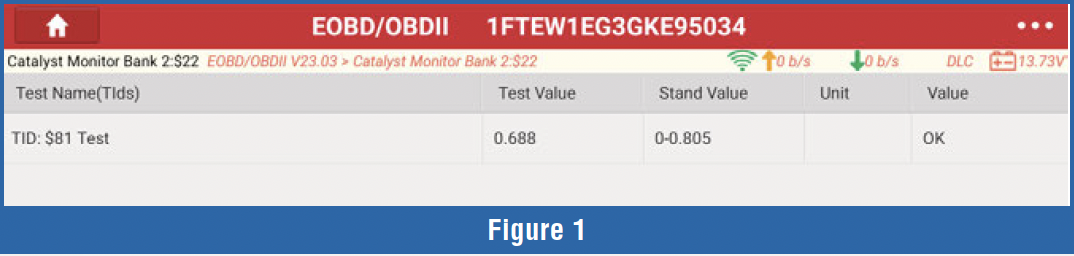
When dealing with multiple codes, diagnose the one with the most authority first. An example of this would be having a code for a gear-ratio error and another for the line-pressure solenoid. Diagnose the line pressure solenoid code first because a faulty line pressure solenoid can cause a gear ratio error code (Figure 2).
 Data PID analysis should start with the key on engine off (KOEO) state. Verify all sensors are reading correctly at KOEO. When looking at KOEO data, it is best to group PIDS together. Group all the temperature sensors together and compare their readings under a cold-soak condition. All temperature sensors should be relatively close.
Let’s say the intake air temperature sensor (IAT) reads remarkably colder than all the rest. This would stand out, and you could test the sensor and wiring. If the IAT sensor was mis-calibrated and reading a colder temperature, how would that affect system operation? The PCM would sense the colder air and give the engine more fuel, which would require fuel trims to subtract the excess fuel. The TCM would assume there was more torque due to the colder, denser air, so it would raise line pressure, causing unnecessary hard shifting. The clues would be negative fuel trims and harsh shifts.
How could you isolate a defective BARO sensor which would affect shift and lock-up strategies? One way would be to group all the pressure PIDs together, BARO, Boost or MAP, and exhaust back pressure. Make sure all the pressure readings are the same. A defective BARO sensor can cause engine drivability issues and transmission shifting issues. If the vehicle is at an altitude of 5,000 feet but the BARO indicates it is at sea level, how will the ECM & TCM react? The ECM assumes it is at sea level, which means more air is available, so more fuel is needed. This overfuels the engine, requiring fuel trims to subtract. TCM will assume the car is at sea level and that more engine torque is available, so it will raise line pressure. This is similar to a mis-calibrated IAT sensor, as the reaction will be negative fuel trims and harsh shifts.

 The trick is that we can catch both problems with KOEO PID analysis without even starting the engine. A tech tip for BARO sensor testing is to compare the BARO reading in inches of mercury with your location’s altitude. BARO should read 30 inches of mercury at sea level, and subtract 1 inch of mercury for every 1000 feet of altitude. It is amazing how many problems can be solved by just scrutinizing the KOEO data PIDS.
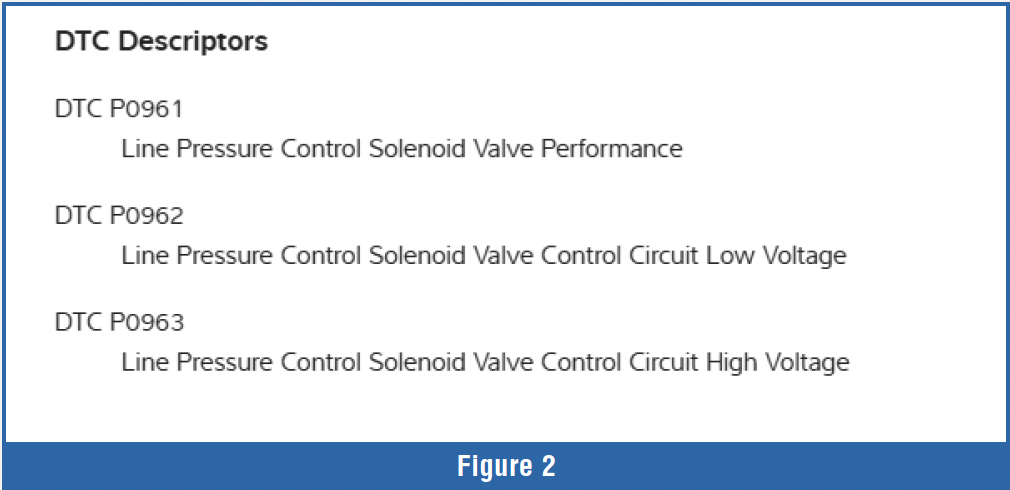
Gear ratio error codes are common in the transmission world. What causes gear ratio error codes? It could be a slipping clutch or band that isn’t holding properly, or a bad speed sensor or related wiring. How can I tell the difference between the two? Slipping clutches will only set gear-ratio errors in the gears where the clutch is engaged. Faulty sensors and related wiring will randomly set different gear ratio codes that don’t have anything in common (Figure 3).
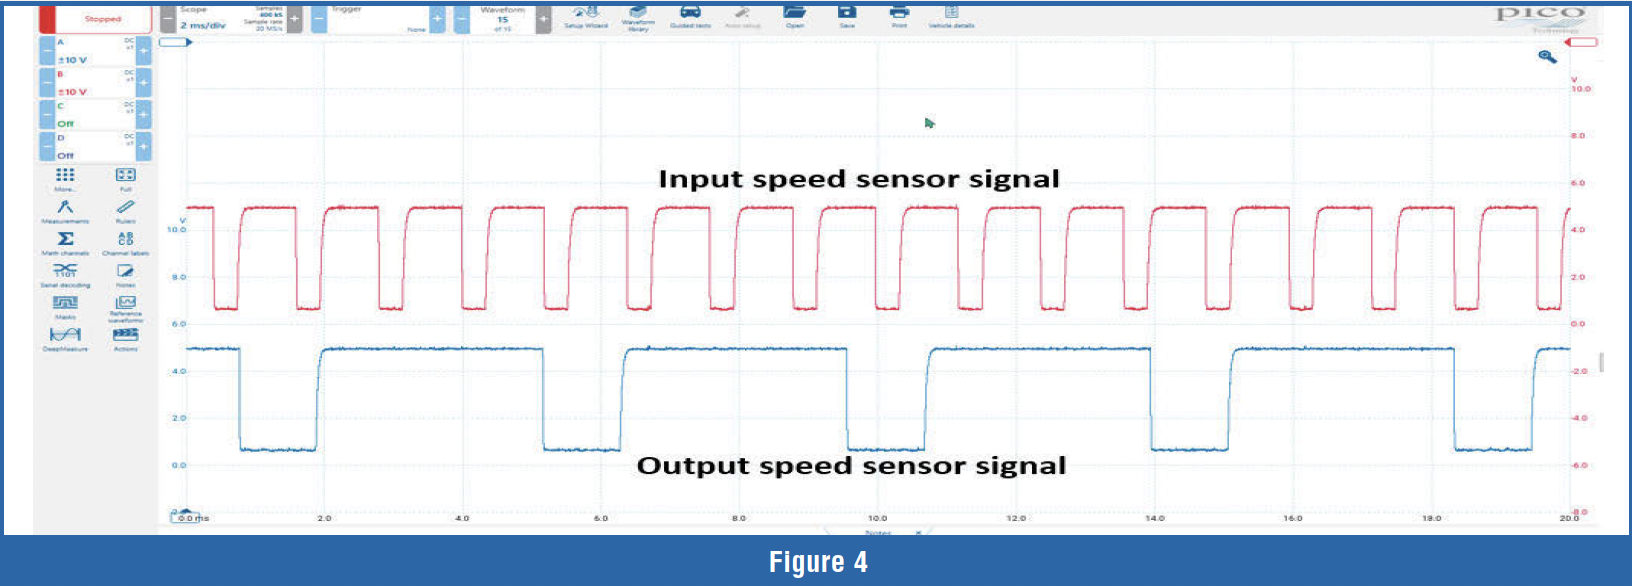 An old trick that sometimes works to distinguish between sensors and clutches is to erase the codes and run the vehicle on the hoist with the wheels off the ground. If it still shows gear ratio error codes, it is probably a sensor or wiring issue due to very little load on the suspected clutch or band. Another method is to bring out the lab scope and retrieve a speed sensor waveform. The lab scope method only works if the speed sensor wiring travels outside of the transmission case. Make sure the waveform reaches the desired upper and lower voltage levels (Figure 4).
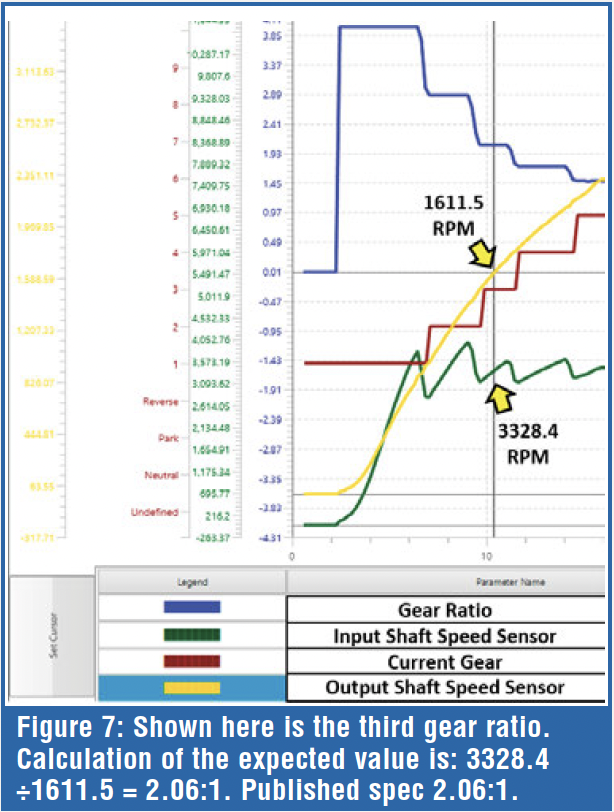
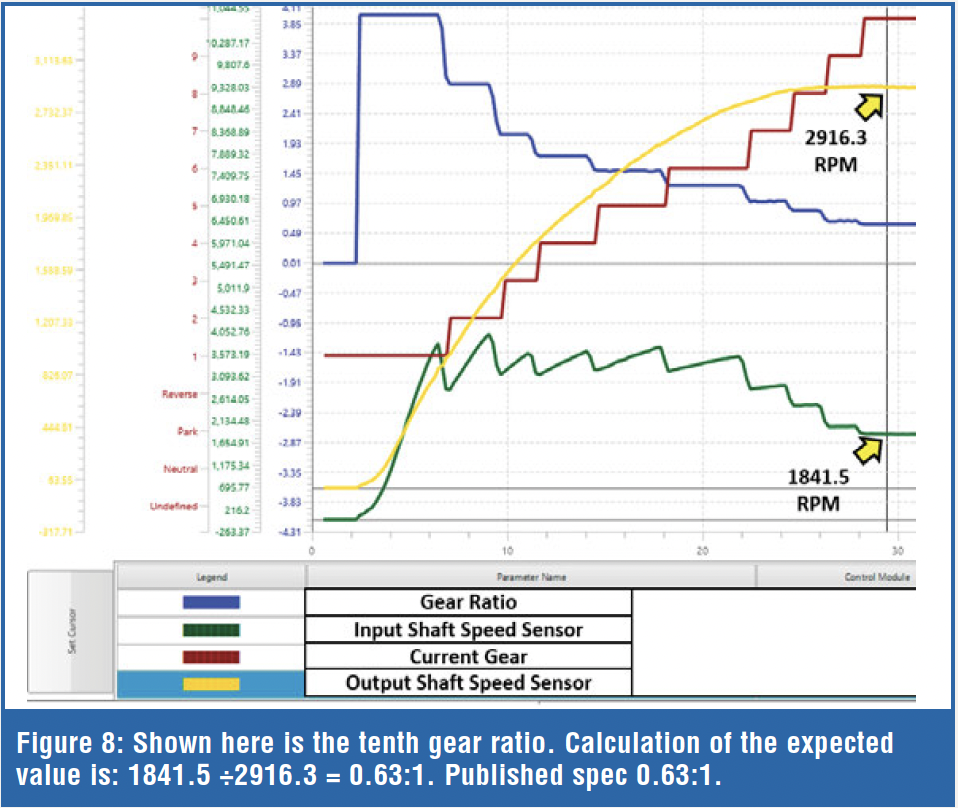
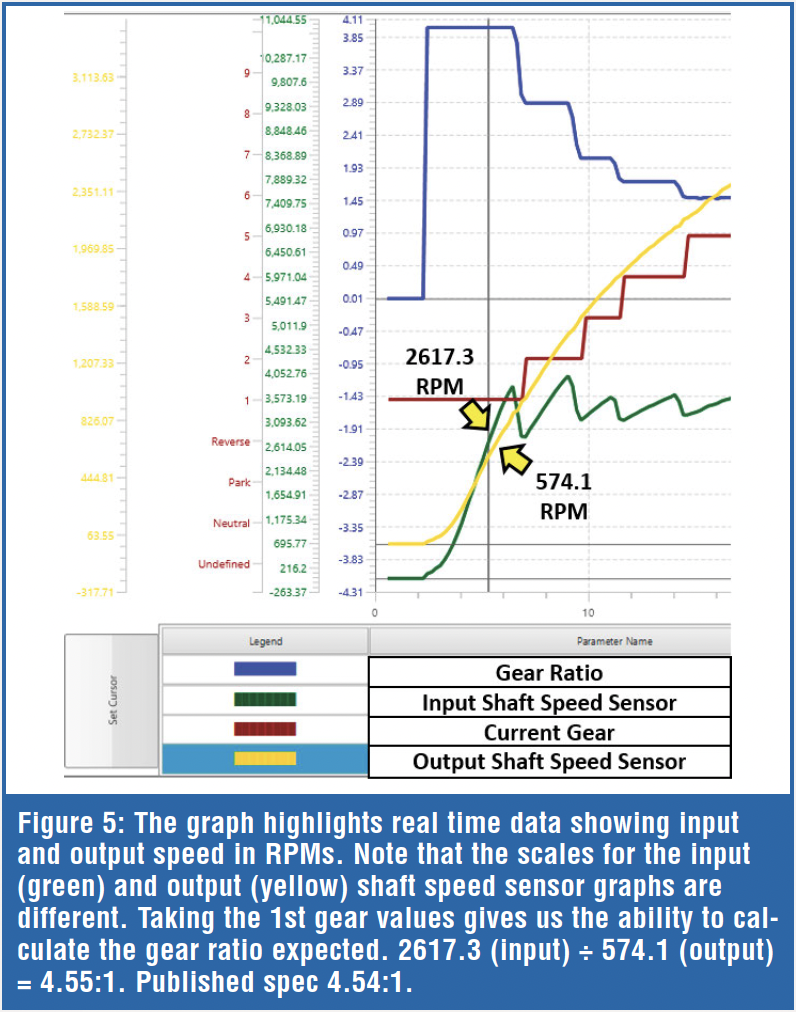 The scan tool usually offers the speed sensor PIDS in RPM. Put your scan tool in graphing mode and graph the input (turbine speed sensor, the front speed sensor), and graph the output (rear speed sensor). What happens between these two speed sensors is all the gear ratios. Use the cursor in the scan tool to measure each gear. To calculate the gear ratio, take the input or turbine speed sensor RPM and divide it by the output speed sensor RPM. The result will be the current gear ratio. Compare the calculated gear ratio with the published spec in service information, and compare it to the scan tool PID ratio if available. Figures 5, 6, 7, and 8 are examples of a 10-speed Allison calculating the ear ratio.
The calculated spec, based on the RPMs of the input and output shafts obtained from the scan tool, matches the published spec, so no clutches are slipping at this time. If we had a gear ratio that didn’t match the spec, it would indicate slippage. The one thing to note is that in first gear, the scan tool reported 4.0:1, which does not match the calculated 4.55:1 or the published spec of 4.54:1. 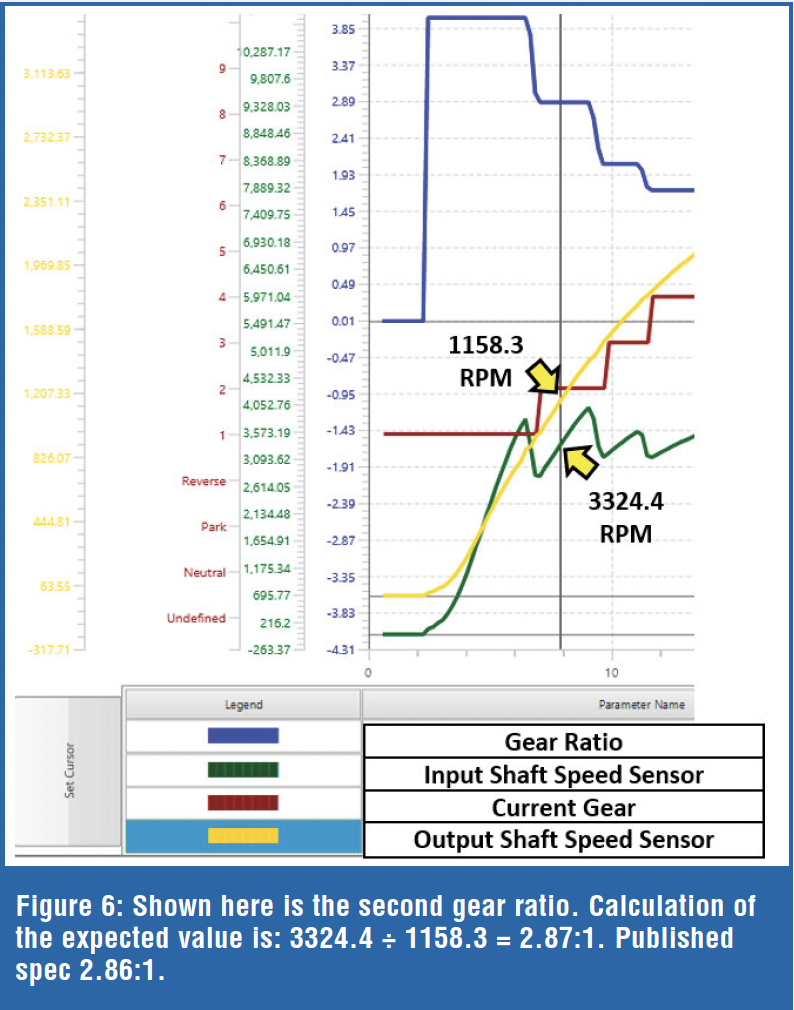 This could be confusing if you were only comparing the scan tool’s displayed gear ratio with the published spec. If it had a code for first gear, which it doesn’t, it may cause you to chase a first gear problem that you don’t have. It would be a logic problem and not an actual clutch or sensor problem. The scan tool used is the GDS, which is the factory scan tool. You would think it would be the most accurate, but in this case, the scan tool displays the first gear ratio incorrectly. Logical problems can lead a technician down the wrong path and result in a lot of unnecessary work.
I will give you another logic problem I encountered with a 68RFE transmission. The shop brought the Cummins-equipped pickup in with a 68RFE transmission and requested that a front pump be installed. I asked why he wanted a pump, and he said that at idle, the requested line pressure is 165 psi, but the actual line pressure is 125 psi. I looked up a spec for idle line pressure, and it was approximately 70 psi. The computer was asking for something the mechanical pump could not do at idle. If you didn’t know this was a logical problem, it could send the technician down the wrong path.
 One more example of a logical problem. Since this problem could apply to any transmission, I will leave the transmission anonymous. The transmission slipped only when driven at 25 mph. The transmission would set an overdrive gear ratio error code. The Dealer diagnosed it as a bad transmission and quoted the customer a price on a rebuilt transmission. It came to our shop, and we tested the line pressure with a pressure transducer and a lab scope and compared the results with available scan data.
We found that line pressure dropped to 39 psi at 25 mph, and, looking at scan data, we noticed the TCM was commanding low line pressure. We could not think of any logical explanation for why the TCM would command such a low line pressure level. We also noticed the TCM would shift the transmission to overdrive at 25 mph. Neither command made sense. The low line pressure and overdrive gear at that low speed were why the overdrive clutch was slipping.
 We performed a reflash to the TCM, and it fixed the issue. Transmission replacement was avoided for the time being. There were no TSBs or reflashing information that addressed this issue, which is why the dealer did not perform a reflash to begin with.
Sometimes, paying attention to the logical decisions the computer is making is just as worthwhile as analyzing the actual data PIDS.
About the Author: Jerry Stewart develops technical training at AVI and teaches automotive technology at Highlands College in Montana. He bridges the gap between industry and academia, equipping students with real-world skills for careers in the transportation field.