Every business runs by its numbers. The most common number shop owners track is, of course, profit. I once heard at a management program, “The most important thing is profit. Everything else is ancillary.” I’d say yes and no to that. Yes. At the end of the day, profit is the most important thing in a business. But all those “ancillary” things get you to the profit. That is, profit is the outcome of all that other stuff.
There’s a terrific book by Eliyahu M. Goldratt called “The Goal.” In it, he introduces the concept of “Theory of Constraints.” It’s a fancy way of saying you’re only as strong as your weakest link. Here are a few simple examples that might illustrate this concept: A shop manager continually forgets to order parts on a sold job. He’s so busy selling that the parts order for the last job sits on his desk until the builder reminds him that he’s still waiting. “Hey, Fred, any idea when my parts for that 6L80 will come in?” Fred rushes to the phone and places the order. The problem is that he called in after the final delivery, so they’ll get the parts the following day. Oops!
Or maybe Fred is so busy selling that he’s got everyone (including the builder) pushing cars in and out to do pan drops. The builder returns to the bench and forgets that he didn’t fully torque the pump bolts. This fumble becomes evident during the startup and fill process as oil oozes down the bellhousing. Something like this happened three times last month. Here’s another: Sally, the R&R tech, just broke another case connector in a rush to get a transmission out. She’s talented and quick, but her output would be better if she slowed down and paid closer attention.
Each of these instances is largely overlooked. Sure, everyone knows it happens. Everyone knows Fred keeps disrupting workflow, but he’s so good at selling that the boss looks the other way. Sure, Chuck, the rebuilder makes a few mistakes here and there, but if the transmission works right on the road test, they rarely return. When Sally’s “on,” she’s a rock star. Those case connectors and other parts she broke were old and brittle anyway. It could happen to anyone. The owner notices a drop in profit (the only thing he’s tracking) but doesn’t know why. If this looks familiar, I’m not surprised. I got these anecdotes from shops I worked at years ago.
So where do you start, and what do you count? To begin with, see what your RO software tracks. Many of them have fields for entering time stamps for various activities like rebuilding times or when you check in the car and when it’s delivered. The thing about data is that once you collect and examine it, anomalies and outliers jump right out at you. If you’re tracking cars in and out, you’ll notice that one, where Chuck forgot to torque the pump bolts. It’ll have an extra three hours attached to it. Once you begin equating lost time to lost profits, you’ll wonder how you got by without your reports. Your team will appreciate it too. Most employees like winning. Chuck will be happy that Fred does a better job of ordering parts on time. Sally will slow down (just a bit) and break fewer parts, and Fred won’t have to push cars in and out as much to do his pan drops because the workflow is so much better.
To give you an idea of how cool this stuff is, I surveyed member shops related to R&R times. The objective was to learn how many R&R instances a shop had based on the number of lifts and R&R techs. I treated an R&R instance as any reason a unit comes out of a vehicle and goes- back in. It could be for a re-seal, using a reman, for a rebuild, or even Chuck’s case of loose pump bolts. It was a small sample of 84 shops. It’s not scientific, but it’ll work for this discussion, and the outcome reflects most of the samples.
 The shops ranged from as few as two lifts to as many as 24. Let’s stop for a moment and state the obvious. If you had a two-bay shop, there’s a limit (constraint) to how many jobs you can run through. It wouldn’t matter if you had one R&R tech or five. Here, the constraint is the number of lifts. For the 24-lift shop, you have a different constraint. Imagine 24 lifts but only one R&R tech. In this case, you might characterize the shop as a parking lot with almost no movement. On the other hand, that 24-bay shop might do more general repair than transmission work, so the R&R techs only use four of the lifts. No problem. We’ll sort through this, too.
 Here’s what we learned. The average number of lifts was about 6.4 (The most common number was five). The average number of techs was two. Now comes the fun part. Using this data’s standard deviation, we can establish high and low values. These values can become our goals (figure 1).
The chart reveals that the average number of units per month (R&R events) is 28.8. A shop that is killing it with throughput and procedures is a bit over 45. The low side is 12.1. In fairness, we don’t know some of the constraints in these shops. And because some shops do more general repair than transmission work, it may skew the results. But it won’t be much. We can also see by the chart that each tech, on average, R&Rs about 16 units per month (along with the high and low values). Finally, the chart shows the number of R&R instances per bay per month. The average is 5.0, with a high of 7.8 and a low of 2.1.
 The numbers in this chart show a broad range and, statistically speaking, a system with little control. However, these numbers aren’t from a single shop over time. The fact that the data comes from 84 shops shows the wide range of throughput. Nevertheless, we could use the information for our make-believe shop and see how Sally compares to the respondents of this survey. It also gives you an idea of what to expect based on your number of lifts. If you’re a 4-bay shop, the average roundtrips would be 20 per month. By the way, everyone I spoke with recognized that “it depends.” That is, some units might take an hour or so to remove, while others take most of the day. Considering many shops work on a similar range of vehicles, it’s all baked into the numbers, so don’t be too concerned about it.
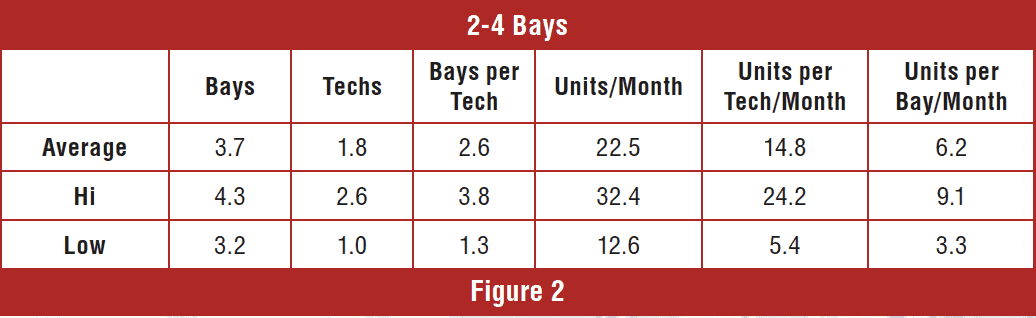
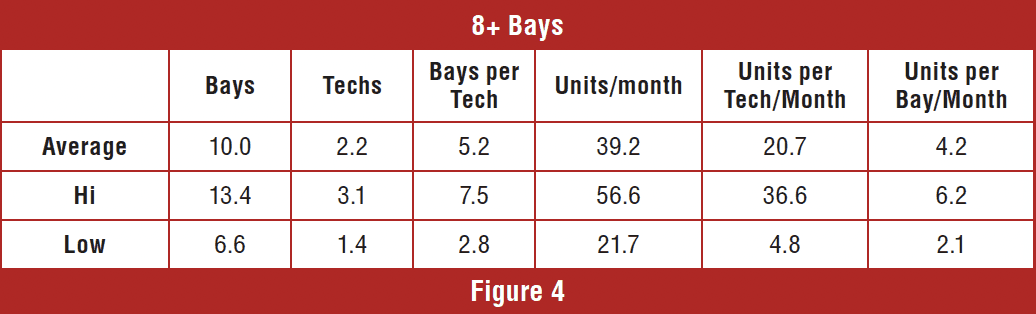 To make this more precise, I broke it down into groups; those with 2-4 bays, 5-7 bays, and eight or more bays (figures 2, 3, and 4, respectively). Here’s a way you can use this information even more. Consider a six-bay shop. The information in figure 2 shows an average of 6.2 units per bay per month. Take 6.2 and multiply it by the six bays, and you arrive at 37.2 units per month. That equals lift capacity. Can Sally do that? Would that be a reasonable expectation? No. The chart shows that the average per tech is 14.8, with a high number (someone with better processes and focus) of 24.2. It takes two, maybe three R&R techs to adequately service the capacity of a 6-bay shop. Fortunately, Sally works at a 4-bay shop and does… Ok.
 The owner of our sample shop started looking at more than the bottom line. He hired a valet, James, from a local trade school (see the May issue of GEARS for more on the valet position). James went through the training on ATRA’s VTS platform. He checks the cars in, does the preliminary testing, and stages the cars onto specific lifts. This keeps Chuck on the bench more, and he’s done better at torquing all the bolts, among other things. In fact, last month, he had zero problems caused by being pulled from the bench. With the valet, Sally feels less rushed and does cleaner work. She feels better about that, and it shows in her attitude. The shop gets about five more cars fixed per month, and the owner likes the results on the bottom line.
Ok, so I made all of this up. What I didn’t make up was the data, which reveals a lot, most notably that tracking these numbers matters. Over the years, Rodger Bland, the Managing Editor of GEARS, and I have conducted numerous surveys and scoured a lot of data. And in every instance, we learned something we never anticipated (and weren’t looking for when we began the survey). Your shop has clues and information on your business that you can’t imagine. Ask the agent of your RO software about the reporting features already built in. If it seems too time-consuming, then take a look at the “screen time” on your phone. You have the time if it’s over an hour each day.
Numbers are great. Knowing what to do with them is a different story. If you want to learn more about this topic, and how to track them in Excel, then take a look at the sidebar of this article. There, I’ll show you how to work your numbers into an effective spreadsheet. It’s what I did to analyze the data from this survey. Have fun with it, and I’ll see you at Expo.