Fuel trim has been a tool in our diagnostic tool chest that we have relied on for some time. Can modern fuel trim strategies be misleading? Can we apply the same fuel trim diagnostics to modern cars as we did on earlier models? How do we know if fuel trims are in a default strategy? These are some of the questions we will answer in this article. But first, let’s review what fuel trims are and how they work. Not all manufacturers use the same name for their fuel trim PIDs; however, for the sake of this article, we will adhere to the SAE terms.
Fuel trim PIDS consist of short-term fuel trim, long-term fuel trim, rear fuel trim, and total fuel trim. Let’s review their operation. Short-term fuel trim is the immediate reaction to O2 sensor voltage. The ECM uses short-term fuel trim to adjust the narrow-band O2 sensor to operate in a rich or lean mode. The goal of short-term fuel trim is to keep the O2 sensor switching in a 200-millivolt to 800-millivolt window. If we can maintain the O2 sensor switching within this window at the correct frequency, we are in fuel control. Short-term fuel trims are disabled during open-loop conditions when we do not want the O2 sensor to switch, such as during enrichment conditions or cold start-up when the O2 sensor is cold.

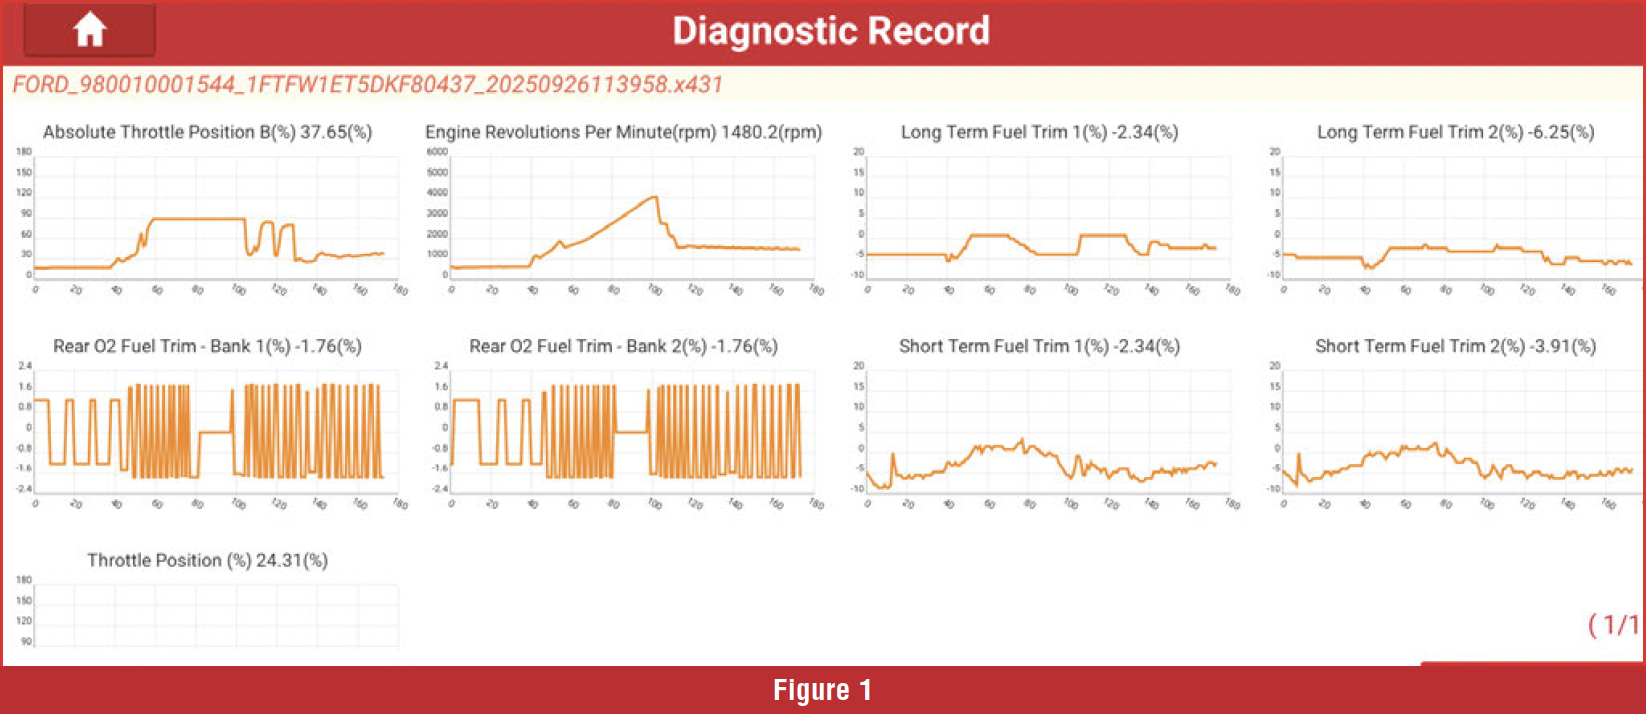
Long-term fuel trims act as a watchdog for short-term fuel trims. If short-term fuel trim starts to work too hard or travel outside a predetermined window, long-term fuel trim will correct the base pulse width to bring short-term fuel trim back to its normal range. Longterm fuel trim corrections are stored in memory load cells. We must drive the vehicle through these load cells and record long-term fuel trim corrections. We cannot just look at fuel trims at idle. Rear fuel trim originates from the rear O2 sensor. The rear O2 sensor, located behind the catalytic converter, monitors the converter’s intake of oxygen to ensure it receives the correct amount, promoting optimal catalyst life. Rear fuel trim contributes approximately a 2% correction to fuel trims under normal conditions; however, we have observed that rear fuel trim has significantly more authority when things are not functioning correctly. Total fuel trim is simply the sum of short-term, long-term, and rear fuel trim. Total fuel trim is applied to the base pulse width to ensure the correct amount of fuel is delivered. Some manufacturers may have a PID for total fuel; however, if not, you can perform the calculation yourself. In Figure 1, you can calculate the total fuel trim for each bank.
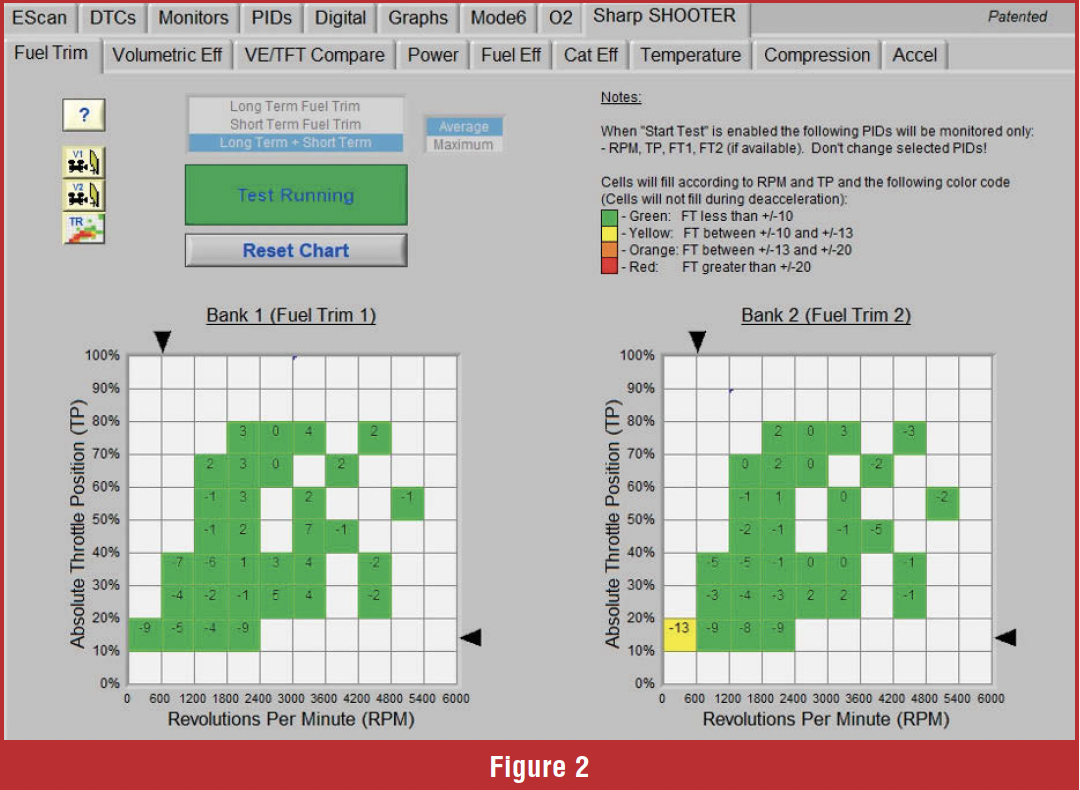
There is a generic scan tool that offers a different way to view fuel trims. The scan tool software features a block diagram chart that utilizes throttle position and RPM as its axes. The scan tool allows short-term and long-term fuel trims to be added together, and the results are plotted onto the chart. The vehicle must be driven through different load cells to fill up the chart. See figure 2.
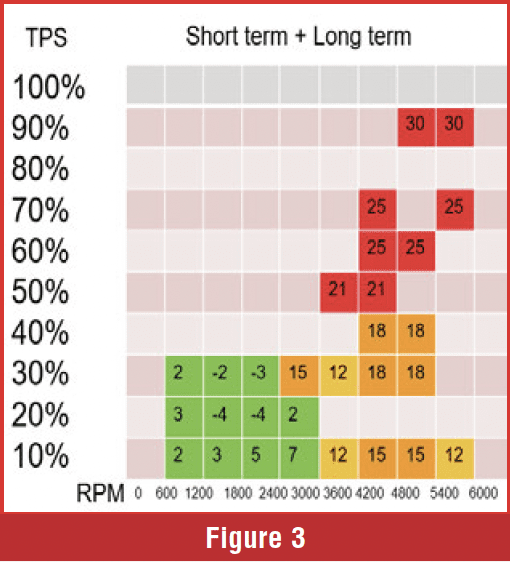
 The basic idea of using fuel trims as a diagnostic tool means we must view them over all load ranges. If fuel trims are high, meaning we are adding a lot of fuel, it means the base pulse width calculation may be wrong due to a load calculation error, or we have a fuel pressure/volume issue. How can we distinguish between the two? Typically, fuel pumps that produce sufficient volume result in high fuel trims in moderate to heavy load cells, but do not cause issues in low-load cells unless the fuel pump is severely malfunctioning. If the air measurement were undercalculated, the fuel trims would be affected across the board. Figure 3 illustrates how fuel trims would appear with a low-volume fuel pump.
 Cylinder misfires influence fuel trims. Misfires create a lot of oxygen in the exhaust, which is picked up as a lean condition by the O2 sensor. The fuel trims start to add fuel due to this perceived lean condition, and now all the cylinders that are not misfiring are all way too rich. The fuel trims on earlier cars would chase this misfire concern with extreme fuel trim adjustments, which would damage the catalytic converter. Another example of poor programming is when the O2 sensor is faulty and not reacting correctly; fuel trims would then be adjusted to the extreme to bring the O2 sensor back into the correct voltage switching window. Figure 4 illustrates an example of a faulty O2 sensor resulting in extreme fuel trim adjustments.
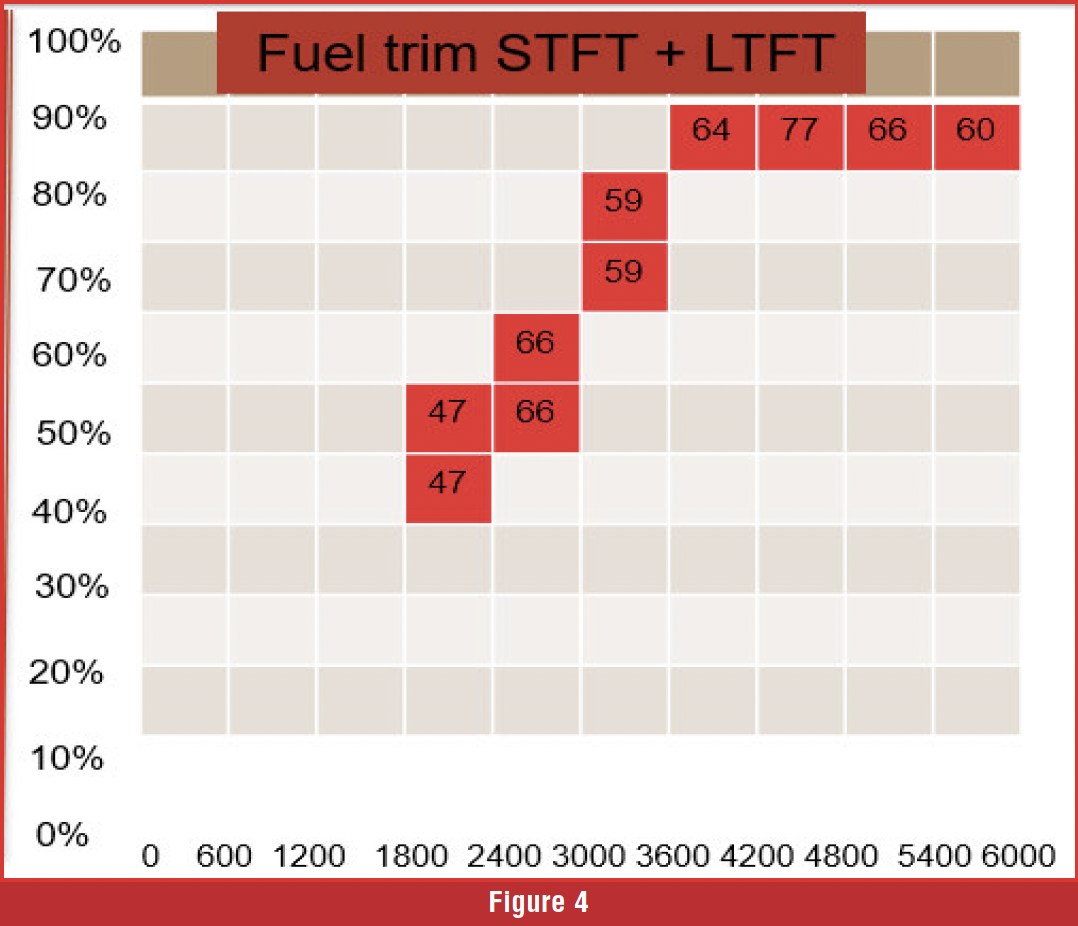 In the fuel trim chart in Figure 4, we can see that short-term and long-term fuel trims added together get as high as 77%. This is the highest fuel trim that I have ever witnessed. Since the fuel trims were adding an excessive amount of fuel, the shop perceived this as a lean condition. They spent hours performing lean diagnostic tests like fuel pressure and fuel volume, chasing vacuum leaks that were not there, and replacing perfectly good MAF sensors. How could we verify if the fuel trims were making the correct adjustment? The shop invited a mobile diagnostic technician to inspect the vehicle. The first thing the mobile technician did was connect his five-gas analyzer to the tailpipe.
 Figure 5 shows Lambda at 0.76. If you’re not familiar with Lambda, it is the actual air-fuel ratio that enters the combustion chamber but is measured at the tailpipe. A lambda of 1.0 is stoichiometric, which means the air-fuel ratio is 14.7:1. Numbers higher than 1.0 indicate a lean condition, expressed as a percentage of the stoichiometric ratio. Numbers lower than 1.0 indicate a rich condition in a percentage. The lambda reading of .76 indicates it is 24% rich. If the fuel trims had been making the correct adjustment, Lambda would be around 1.0 plus or minus a couple of percent. The reason we are so rich is that the fuel trims are adding fuel that we do not need. It is cases like these that prompted some of the manufacturers to implement default fuel trim strategies. Some manufacturers implement protective fuel trim strategies to prevent catalytic converter damage during fuel system faults by limiting enrichment, disabling adaptive trim on one bank, and using the other bank as a reference. These default strategies do not always set a code. Here is an example: if we have a misfire on one bank of a V-style engine with an upstream O2 sensor in each bank, the fuel trims will add fuel to the misfiring bank only. The ECM will chase the perceived lean condition for a bit, but when it sees that the other bank is not making the same correction, it will cease chasing the false lean condition, and the fuel trims on the misfiring bank will mimic those of the good working bank. This default strategy will not affect our diagnostics. We used to be able to tell which bank the misfire was on by watching fuel trims, but now they look the same. If the front O2 sensor malfunctions and causes an extreme fuel trim error, the ECM will now recognize that the correction is too large and pull the fuel trims back, preventing damage to the catalytic converter. These default strategies may lead the technician down the wrong path during their diagnostic routine.
How can we circumvent the default strategies? If you think the fuel trims are acting in a default strategy, erase all codes, even if there are none, and reset the fuel trims if your scan tool allows that function. Test drive the vehicle through all load ranges while you record the fuel trims. If the fuel trims start to chase a problem, you will now have the data you were looking for. When you suspect a problem with fuel trims, two PIDs that you want to pay close attention to are the load PID and the equivalence ratio PID. We published a previous article that explained how important the load PID is to the ECM for commanding the correct base pulse width. In that article, we mentioned that there are two load PIDs: absolute load on the generic side and calculated load on the OE side of the scan tool. Refer to that article for a better understanding of how to verify the accuracy of the load PID. It is imperative that the load PID is accurate to create the correct base pulse width. The equivalence ratio (EQ) can also be helpful for some vehicles. EQ works the same as Lambda, which we previously described. An EQ of 1.0 corresponds to a 14.7:1 air-to-fuel ratio. As the numbers increase, it is lean; as the numbers decrease, it is rich. It is important to realize that vehicles equipped with upstream narrow-band switching O2 sensors, the EQ PID is just a command. It is not the actual air-fuel ratio. The EQ PID on these vehicles is not that helpful. Vehicles that use wideband air fuel ratio sensors upstream, the EQ is measured by the wideband sensor. The EQ PID is very helpful with these vehicles.
During the scan data recording, we switched to enrichment mode while accelerating, and the EQ dropped to 0.84 during wide-open throttle. The wideband sensor measured the air-fuel ratio at 16% rich of stoichiometry. This is a normal reading during wide-open throttle events. How do we verify that the sensor is accurate? Simply compare the EQ ratio on the scan tool to the lambda readings on a five-gas analyzer, and that will verify if the wideband sensor is accurate.
In summary, modern cars are becoming increasingly intelligent and adopting more effective strategies. It is important to recognize these changing strategies when we are diagnosing vehicles.
About the Author: Jerry Stewart develops technical training at AVI and teaches automotive technology at Highlands College in Montana. He bridges the gap between industry and academia, equpping students with real-world skills for careers in the transportation field.