When diagnosing transmission issues, there are multiple paths a technician can take to determine the fault. As technicians, we hopefully have an arsenal of tools ranging from the expensive scan tool and scope to the inexpensive test light or jumper wire and guiding our way should be the trusty service information loaded with descriptions and operation, DTC and symptom-based diagnostics, and of course a wiring diagram. If we’re really lucky, we’d also be blessed with a hydraulic schematic. So, with all this information and tooling handy, how do we make use of it all? Unfortunately, in some cases, it’s not used, and we find ourselves speculating at the failures. This might be because we don’t have knowledge of the systems, or maybe we don’t have the proper equipment, or maybe we just don’t have time to diagnose. If you’re reading this article, you’ve made the time to increase your knowledge and hopefully this information will help reduce the amount time needed to diagnose an issue! In this article, I’m confident that with a little analysis of the scan data, you can make some educated conclusions about the hydraulic and electrical operation of the Jatco CVT.

You might have heard the saying, “in order to know what bad looks like, you need to know what good looks like.” Let’s take that advice by reviewing some scan data from a typical Jatco JF011E (RE0F10a) CVT found in a 2013 Mitsubishi Outlander. With this vehicle, there are PIDs that provide excellent insight into the operation of the CVT. For example, the stepper motor PID and the gear ratio PID should be perfect mirror images of each other like displayed in figure one. If the stepper motor is changing position (counts or steps) but the gear ratios aren’t reflecting that change, that’s a big problem for transmission operation and it’s possibly the result of low pressure.


The primary (if available) and secondary pressure PIDS are extremely useful since they are direct measurements of the primary and secondary pulley pressures. This information can tell you if the pump is outputting required pressure necessary for proper ratios and to prevent clutch or belt shuddering and slipping. A tech can monitor this pressure to see if the proper range of pressure is achievable. Low line or secondary pressure is typically a result of a sticking pump flow control valve or possibly from a massive leak, such as a damaged pulley piston and seal, like in figure two. The big issue with the pressure PID is that on some vehicles, it’s only displayed as a voltage, and it’s not converted to a pressure unit of measurement. On this Mitsubishi, we are lucky to have PIDS that show voltage, pressure, target pressure and amperage for the secondary pressure circuit and also expected (target) line pressure, even though there is no pressure transducer for the line pressure circuit.


Often, we are only provided a voltage value for these pressure sensor circuits, like with many Nissan vehicles. Because of that, many techs will ignore this PID because the voltage values don’t mean anything to them if they aren’t converted to something they can use, such as PSI, BAR, or Kilopascals.
At this point, I’ve been making the assumption that you all know the general operation of the JF011E. There are many resources out there that explain the general operation of Jatco CVTs and a quick search at Gearsmagazine.com will provide you with many results, but here’s a very brief description on how this transmission works in a paragraph or two. Like with most CVTs, the primary and secondary pulleys open and close to force the belt to change its effective diameter. When the pulley halves are squeezed together, they force the belt to climb toward the outer diameter of the pulley, and this simulates a large gear. When the pulley halves are spread apart, the belt rides toward the inner diameter of the pulley, and this simulates a small gear. So, when the primary (input) pulley has low pressure, the pulley halves will separate, and the belt will simulate a small gear. During this situation, the secondary pulley (output) will operate at a higher pressure, which forces the pulley halves closer together, simulating a large gear, resulting in a gear reduction like shown in figure three. The process reverses to transition from an underdrive to an overdrive.

These Jatco CVTs can control ratios by allowing solenoids to directly control the pressure in each pulley assembly, or such as on this JF011E, by using a “stepper motor” that positions a hydraulic valve in the valve body to either “feed,” “hold,” or “vent” pressure to the primary pulley. This, in conjunction with a secondary pulley pressure solenoid, will allow ratios to change.
So what are common CVT pressures? As you can see by reviewing the scope traces in figure four, the pressures are pretty active in a CVT during this 20 second sample. The line pressure (red) ranges from a low of about 140 psi at idle to a max pressure approaching 900 psi during a stall test. The primary pressure (green) ranges from a low of about 120 psi to a high of over 700 psi, and the secondary pressure (gold) ranges from around 60 psi to almost 900 psi, just like line pressure. In fact, the secondary pressure was brought up to the same as line pressure when loads were increased and when forcing the pulleys to a lower ratio. This makes sense, because the additional squeeze on the secondary pulley is necessary to prevent the belt from slipping under load and the increased pressure will also force the secondary pulley to act like a larger gear. After seeing how active pressures are during the drive cycle in figure four, it’s no wonder that proper pressure control is imperative to the reliability of these CVTs.

A slightly closer look into the hydraulic operation for this JF011E shows that the oil pump pulls fluid from the sump, pressurizes it, and delivers it to the pressure regulator valve, secondary regulator valve, solenoid regulator valve and the ratio control valve. The TCM controls the line pressure and secondary pressure by pulse width modulating solenoids, and it uses a stepper motor to control the position of the primary pulley by either feeding, holding, or venting pressure as mentioned earlier. Any issues with pump output or pressure regulation will have detrimental effects within this transmission.
Common failures of the pump include a stuck flow control valve as shown in figure five. The flow control valve provides a bypass for the pump’s output by delivering it back into the pump’s inlet. When the pressure differential between the each side of the flow control valve is over about 60-70 psi (as determined by the spring), the valve opens to a point where the pump pressure will dump right back into the pump inlet, causing a reduction in pressure. A simplified hydraulic layout of the flow control valve is found in figure six. I compare the flow control valve function to the operation of a turbocharger’s bypass valve that diverts boosted air back into the turbo inlet to prevent pressure shock when the throttle is closed. In this CVT, when pressures change dramatically, the pump has a way to divert back into the inlet through the action of the flow control valve.

Depending on the year and application, you might find that the JF011E monitors the primary and secondary pressures with three-wire transducers. The 2013 Mitsubishi Outlander used in this article only had a secondary pressure transducer. The Snap-on scan data shows a Primary Pressure PID, but the values remained at zero, and since this vehicle has no DTCs and works perfectly fine, it can be assumed that it’s just a unit that doesn’t monitor primary pressure. Although it would be nice to evaluate both primary and secondary pressure with a scan tool, we can still gain a great insight into the hydraulic integrity of the pressure control circuits by monitoring the actual secondary pressure. So when diagnosing a symptomatic CVT that may contain DTCs such as P0746, P0776, P0777, and P0868, consider evaluating the following.
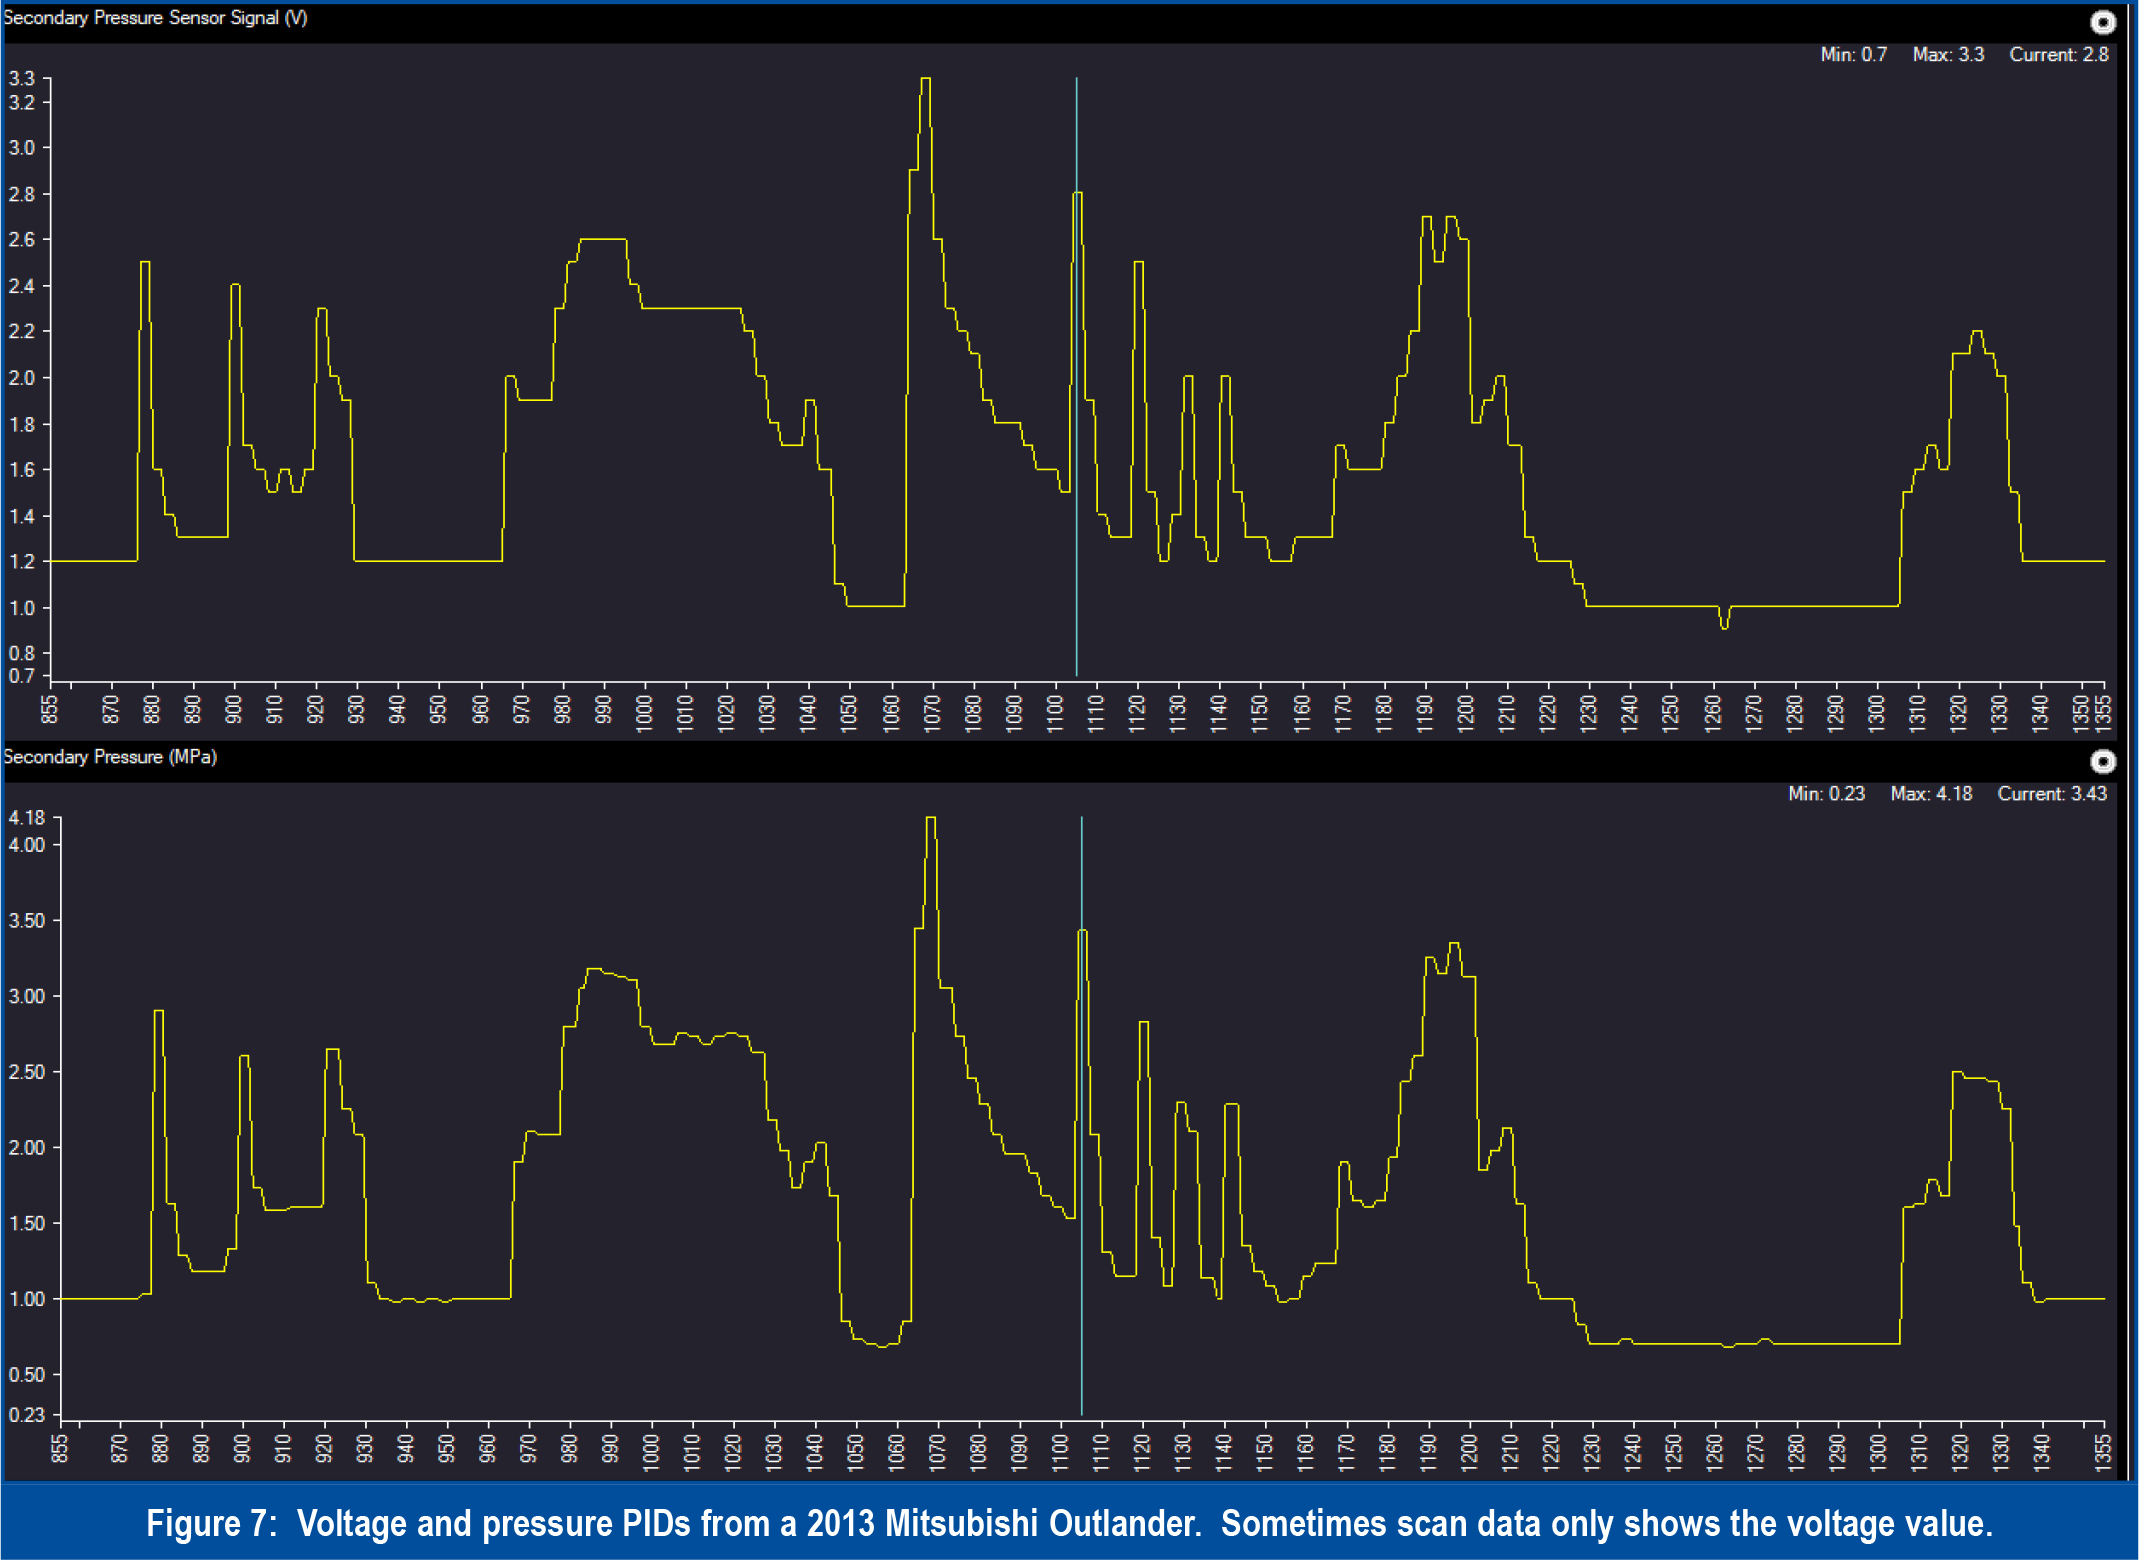
Scan data: Monitor pressure PIDs if you have them, but if you don’t, still monitor the voltage PIDs for the pressure sensor(s). When the transmission is operating at low pressures, expect a secondary pressure voltage of around 0.7 of a volt. This pressure occurs while idling in gear, but not moving. The highest pressures in this transmission occurs when the transmission is transitioning from a “high” gear to a “low” gear, like just before coming to a stop or when performing a stall test. The transmission also peaks pressure when manually “paddle” shifting, if the vehicle has that feature. Monitor the voltage peaks either just before coming to a complete stop or while manually shifting, or if you have enough confidence in the transmission, you can perform a stall test. The secondary pressure transducer voltage should jump over 3 volts, which translates to at least 550 psi.  The graphed secondary pressure transducer voltage should be relatively smooth during driving, with peaks when forcing lower gear ratios as can be seen in figure seven. If the voltage is erratic or if the voltages don’t elevate high enough, you can suspect pump circuit issues, such as leaks, pump damage, etc. Also be aware of what scan tool values are directly measured vs. the values that are calculated. Using this vehicle as an example, there are pressure PIDs for line pressure, secondary pressure, and primary pressure, but this transmission only directly measures secondary pressure as can be seen in figure eight. As mentioned earlier, the Primary Pressure PID stays flatlined, but the Line Pressure PID actually provides a value. Just realize that this value is calculated, not measured.
Scope Diagnostics: What if you don’t believe the data from the primary or secondary transducer? You can use gauges to monitor the pressure, but be sure they are rated to at least 1000 psi. If you have a scope that allows you to make custom ranges, you can purchase 1000 psi transducers off Amazon or Ebay for about $25 a piece (figure nine). These sensors don’t work with the Snap-on scope’s built in transducer settings, so unfortunately if that’s all you have, you’ll have to pony up for the high dollar transducers that Snapon sells. A transducer will allow you to monitor pressure as you drive and you can compare these pressures to the expected pressures displayed on the scan tool. If your data stream isn’t displaying target pressure, you can at least monitor the pressure to determine if it’s achieving a typical low and high pressure range as described earlier.
When diagnosing pressure issues, make sure you check them cold and hot. As the fluid temps increase, pressure problems typically become worse. Most Jatco CVTs provide the ability to measure line, primary, secondary, forward and reverse clutch, and also TCC apply and release pressures. I typically monitor the line, primary and secondary pressures, as shown in figure four. Also, I prefer to use a lot of time on the screen (20 seconds or more), since the scopes I use allow me to zoom-in as necessary. Transmission pressures aren’t fast switching signal like you’d find with speed sensors signals or network messages, so collecting your pressures over a longer timebase paints a better picture.
On this JF011E, I had to adapt the case plug to allow for a secondary pressure measurement since the pressure plug isn’t a conventional size as seen in figure nine. Secondary pressure and line pressure values are typically pretty close to each other, except when the vehicle is at idle (secondary pressure is lower than line). Since the secondary pressure circuit uses a pressure transducer from the factory, so long as you trust the sensor’s output, you can use your scan tool for this measurement.
 The factory service manual is only slightly helpful when it comes to pressure testing, since it doesn’t provide pressure values during normal operation. The specs in the manual, seen in figure ten, either identify no-load values, such as the specs for the 2013 Outlander, or it provides limited data for idle and stall tests, like with this 2012 Altima. So when testing this CVT, not only should the pressure control system pass the published specs, but it should also display the wide range of pressure delivery as shown in figure four with peak pressures occurring during transitions to low ranges and during a stall test. Figure eleven shows a scope trace when performing a stall test and the line pressure reached almost 900psi. The scan data in figure twelve agrees with the pressure test results proving the pump circuit and electronic transducer circuits are working fine.